
A tool for cartographers to quickly and easily design maps for the web using custom data. It is built on the powerful open-source map rendering library Mapnik.
Highly customizalbe, open source mapping platform for developers and designers.
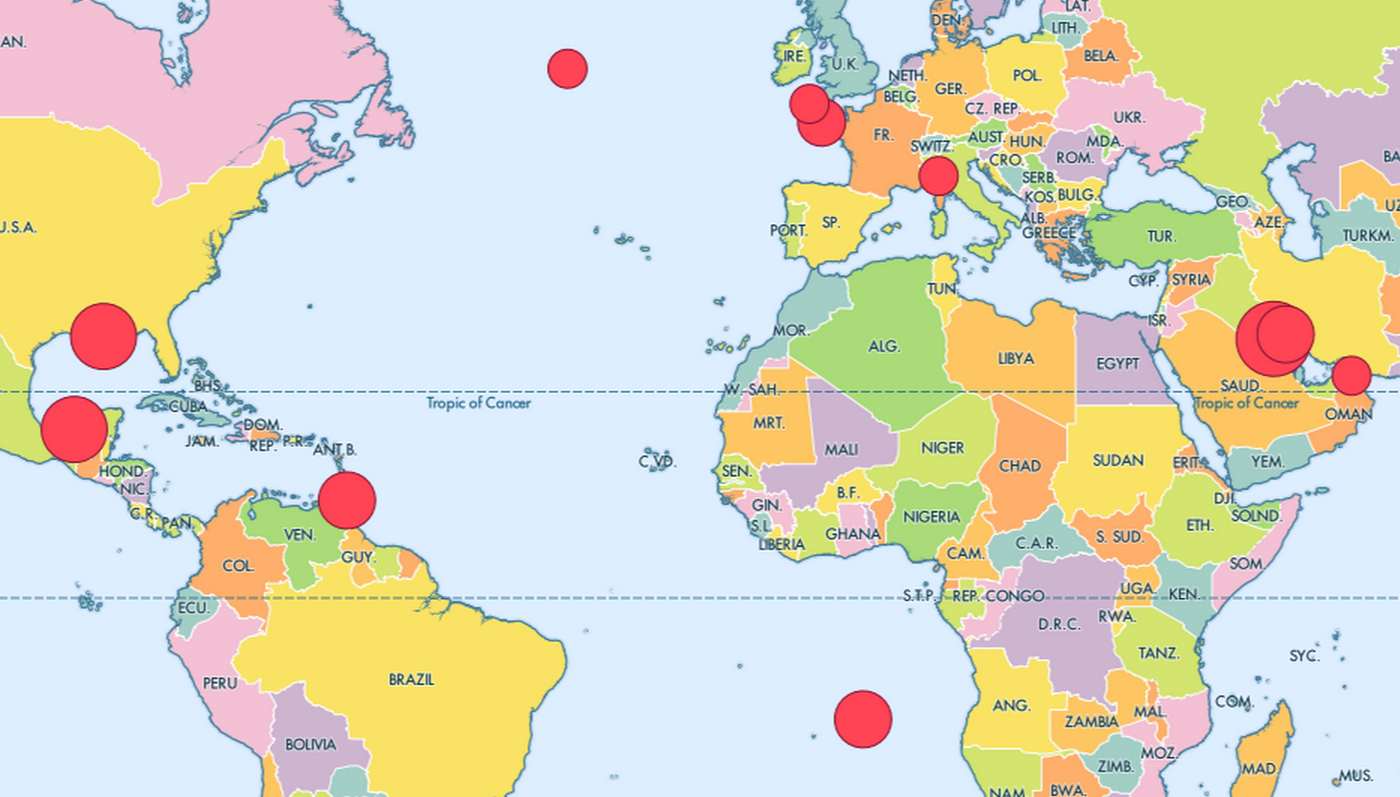
Highlighting 15 major oil spills around the world. The magnitude of each spill is displayed and weighted by the size via a red dot. When hovered, each dot displays the estimated amount of oil spilled (in millions of gallons) at each site.
Using a graduated color scheme, the amount of oil (in millions of gallons) produced by each country is visually highlighted.
Using a similar graduated color scheme, the amount of oil consumed (in millions of gallons) by each country is visually highlighted.